Acid-Base in real life
| February 15, 2014 | Posted by Melinda under Vet & Sports Medicine |
Today I try to apply a real life endurance scenario to the acid base concepts we’ve been discussing.
Do you ever wonder how blood work reference ranges are determined? Did you know that it can be problematic to use “regular” intervals on an endurance horse, or an endurance horse during a race? And yes, this has everything in the world to do with endurance and acid/base.
As you might recall from last year’s series on acid base balance, the plasma in the blood is a very good source of information of what is going on in the body. Let’s do a quick review. Plasma (the non-red blood cell part of blood) is part of the extracellular body water compartment. The extracellular compartment (ECF) is all the body water OUTSIDE of the cells, the intracellular compartment (ICF) is all the body water INSIDE the cells. As you might recall, WATER (which was the focus of our previous discussions on the topic) can move freely between the ECF/ICF barrier). The ECF has 2 subcompartments – the plasma and the interstitial fluid. The divider between the ECF let’s a lot more through – it’s less of a solid wall and more of a chain link fence. As long as the particle isn’t too big it can flow freely from the interstitial and plasma. Thus, when you take a blood sample and measure the things in the plasma, you are measuring the concentrations of the “stuff” that is present in the plasma AND the fluid that bathes the outside of the cells.
What we AREN’T measuring is the stuff that is inside of cells. That’s why when you look at blood work results, potassium is a relatively tiny number compared to other electrolytes like sodium and chloride. Most of the potassium is INSIDE of the cell and thus isn’t measured.
In summary, blood work is a representation of what is in the ECF, not a total of what the body is composed of. We can make some deductions of what might be happening in the cells based on what we can see in the plasma/interstitial fluid – but we aren’t measuring ICF directly.
The most important part of interpreting ANY type of diagnostic – whether it’s the physical exam, the results of a flexion test, a blood chemistry, heart rate etc is to figure out what is normal.
When looking a the results of blood work, you will notice there is a normal “range” that we expect the results to fall into.
These reference ranges are developed exactly like you might expect.
A bunch of animals (in the veterinary world, sometimes that’s as few as 10, but more is usually better) that seem healthy are tested and their results are recorded. Usually the results cluster around some average number, and a statistical calculation is applied to determine what the upper and lower range should be so that about 95% of normal/healthy individuals will fall within the range.
Like any fancy result……the end result (ie the reference range that is generated) is ONLY AS GOOD AS YOUR ORIGINAL DATA.
Can you guess the problem with the reference ranges?
Do you think all breeds are represented in that “normal group” of test animals? How about ages? Fitness levels?
A very fit 100 mile 14 year old arab may have a different base line than a sedentary but healthy 5 year old quarter horse. What about horses like Friesians or drafts that are different in a LOT of very visible ways – do their blood chemistries differ? What about the very young or the very old? The 48 hour horse, the yearling, and the 30 year old?
Fortunately the reference ranges do seem to work for the majority of animals we see, especially when it comes to pH and electrolyte levels. However, a modified reference range for a particular sub population of animals is often not available and for the extremes of the population like the examples above the vet has to use professional judgement whether to “believe” a test result that falls outside as abnormal (or inside as a “normal”).
A couple months ago I saw an article at TheHorse.com about a study was sponsored to establish “normal” CBC/chem ranges for Friesian horses. There was a good number of horses that participated and while most of the reference ranges for the “typical horse” turned out to be appropriate for Friesians, there were a couple of oddball differences.
I think before I went to vet school I saw blood work as the magical test that gave me the numbers that I could calculate the answer. Now, I understand that bloodwork is just another diagnostic. Just like the physical exam, and the radiograph, and the ultrasound. They all have their limitations. The vet’s job is to put all the diagnostic information together and decide what is useful information and what matters and what doesn’t.
I told you all that to tell you this: blood work may be getting more useful for competing endurance horses. Blood work (or the “CBC/Chem”) is already a really good diagnostic test, but like any diagnostic, it could be made more useful.
I’m always excited when we can make an already affordable diagnostic more useful. While it’s nice that nowadays we have the option of MRI, CT’s and who knows what else for our horses….those options are out of my budget. Out of my budget now, and probably out of my budget in 20 years. My horses aren’t insured and while I love my animals dearly I’m realistic about my finances and what it costs to replace an endurance horse.
Just because I can’t afford (and the majority of my clients can’t afford) the “top new sexy” diagnostics doesn’t mean that insightful diagnostic tests can’t be done! Improvements to the “tried and true” methods of detecting and evaluating disease are probably more valuable to a client and vet like me. Here’s some examples off the top of my head:
– A better stethoscope means I can do a better physical exam.
– A better ultrasound probe means I can see what’s going on better. I just finished a cow abdominal ultrasound lab and the resolution is TERRIBLE. The horse is slightly better. But nothing like what you can see in a small animal.
– Switching to digital xray instead of the old “film” means better resolution and being able to see more details. One of the factors in realizing that “navicular disease” was actually a spectrum of different diseases affecting many different structures in the horse’s heel area was the increasing popularity of digital Xray. Of course things like MRI and CT contributed, but it’s AMAZING how much more you can see on a digital radiograph as compared to the old films.
But I’m getting distracted. Back to blood work, acid base balance, and reference ranges.
At Tevis I signed up to have Farley’s blood drawn at Robinson Flat, which is about 35 miles into the race. The study is looking at whether some parameters of the CBC/chem could be used as an early predictor of metabolic issues, or horses that are more likely to pull later in the race.
Considering everything we have talked about, can you see why this is so exciting?
We can compare the mid-race endurance horse blood work to the “average resting horse” blood work and see that most horses finishing an endurance type race have a slowly developing metabolic alkalosis. This is important information. However, to interpret these expected changes against other endurance horses’ results doing similar efforts can help us figure out the significance of the changes.
For example, after seeing Farley’s Tevis results, I know that at Robinson Flat, she had a slight metabolic alkalosis. Since I’m in the habit of reading equine exercise physiology books as my non-fiction of choice, I know that is expected. Should I be concerned?
Without knowing how Farley stacked up to other horses doing a similar effort…I’m not sure!
Knowing what to expect (ie, knowing the “normal”) is incredibly powerful. To interpret a mid-race result, we need the results from that small sub-population of equids that are competing in endurance race. (as well as our “normal” values).
Hopefully the Tevis bloodwork studies over the last couple of years is a step in that direction.
Wouldn’t it be awesome if this relatively cheap, available diagnostic could give us more information about what happens internally and unseen in a 50 mile or 100 mile race?
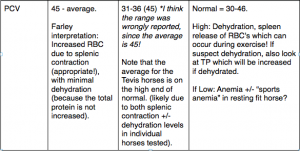
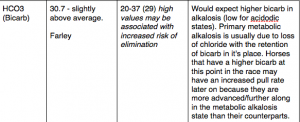
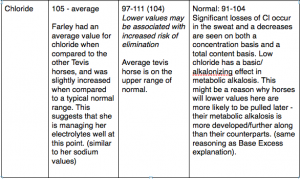
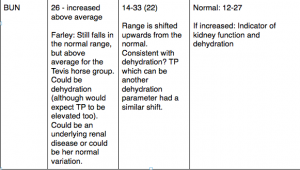
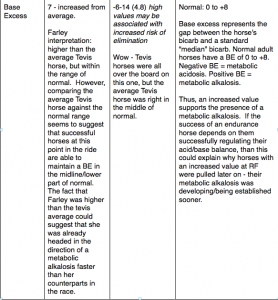
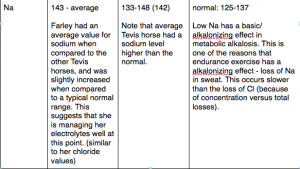
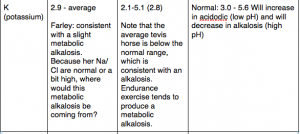
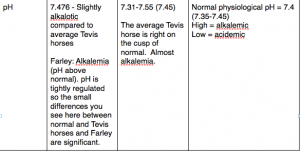
Here were Farley’s results, along with the study’s reported ranges and averages for the Tevis horses. The “normals” referenced are the ones I use for the UC Davis lab – each lab has their own reference range of normals – so it may not be completely accurate. However, it will give you an idea of how close or far off the Tevis population is.
Please note that the result interpretations in this table are my own and NOT from the study. Any errors are my own!
Quick reminder in case you don’t have time to go through the acid base stuff: Over the course of an endurance ride it is the tendency of horses to slowly develop a metabolic alkalosis (because of loss of chloride in the sweat etc.). It has been suggested that you can control this developing alkalosis by “proper” elyte dosing, but exactly how to do that, and how exactly it affects performance is not clear. It has been said that the limiting factor in endurance horse performance is its ability to control their elytes and metabolic status.
I can’t figure out how to insert a nice little table into the post, so instead you get screen shots. :(. First pic is the header for the rest of the figures.
Summary:
Farley had a slight alkalemia (the term used for blood pH above normal) that was slightly more than the “average” Tevis horse. Her BE number supports a developing metabolic alkalosis – she’s within the range for a normal adult horse, but she’s higher than the average Tevis horse. The slightly decreased potassium also supports that there is a alkalotic state in the body, since during alkalosis more K is driven into the cells, and therefore less can be measured in the plasma. Although she seems to be managing her hydration (PCV, TP compared to average Tevis horse) and elytes well at this point, she seemed to have a slightly more developed metabolic alkalosis at this point in the ride than other horses. It’s slight, but it’s there. She wasn’t the worst (and we made in 85 miles probably as a result) but there were other horses there that were managing their acid/base/pH better.
This is where it gets tricky. I would expect Farley’s Na and Cl to be decreased. A drop in Na and Cl is what contributes to the development of a metabolic alkalosis and in Farley both these parameters are average or slightly high. Why is she alkalotic?
The only thing that stands out to me as weird is the TP and the BUN. Why are they telling me conflicting stories? If she was dehydrated (supported by an increased BUN) than why is the TP so low (reliably increases during dehydration)? If she wasn’t dehydrated, than why was her BUN increased? All the parameters that have to do with the amount of bicarb are increased – why is she retaining bicarb if her chloride isn’t low?
I’m not sure what the answer is and I think this perfectly illustrates the difference between book learning and then applying it to real life to a group of horses and then translating to an individual horse. Understanding the physiology helps me to interpret what is likely happening (and perhaps finding a solution), but getting the numbers is no guarantee of any easy answers.
(Of course, there’s another explanation for the weirdness of her blood work: either I’m a stupid 3rd year vet student that’s missing something obvious, or the accumulation of bicarb without the loss of chloride or hypovolemia (dehdyration) could be because of a cause unrelated to endurance riding – several chronic diseases spring to mind, which I won’t go into right now)
The bottom line is that interpreting the Tevis blood work results for Farley was only valuable by having all 3 “legs” of the 3 legged stool
1. The normal ranges
2. The results for the sub population
3. An understanding of the the physiology and mechanisms behind the numbers.






I loved this post! In the med world we have to think about different ages sizes etc, but different species?? You vets are impressive.
Also note that even though giving elytes suggested as the solution to the metabolic alkalosis that develops over endurance rides by some authors – because Farley’s elytes are in the high/normal range I’m not sure that is the answer in this case. Her metabolic alkalosis does not seem to be driven by low chloride or sodium. This is another example of how a general recommendations may not apply in specific circumstances.
If I come across something that explains Farley’s blood results better I will update this post :).
Catching up after being away for a bit – I know of a couple of race horse trainers here in NZ that have a standing order for weekly blood work on their top horses so that they have a ‘normal’ profile for that horse as some things can be a little out of the normal range, but normal for that specific horse when in full work.